
MICCAI 2017 Satellite Event
RETOUCH results were announced on Sep 14th, 2017 at a joint OMIA-RETOUCH workshop at MICCAI 2017 in Quebec City, Canada, and are summarized below. The challenge consisted of 70 training datasets (OCT scans with reference annotations) and 42 test datasets (OCT scans, 14 per Cirrus/Spectralis/Topcon device). Eight teams participated in the RETOUCH challenge by submitting the results on the test set and providing a paper describing their algorithm.
The 1st place was awarded to team *SFU-ENSC (School of Engineering
Science, Simon Fraser University, Canada). *
Donghuan Lu, Morgan Heisler, Sieun Lee, Gavin Ding, Marinko V.
Sarunic, and Mirza Faisal Beg:
"Retinal Fluid Segmentation and Detection in Optical Coherence
Tomography Images using Fully Convolutional Neural Network".


Participating Teams
| Name (alphabetically) | Affiliation | Contact | Paper |
| Helios | IIIT Hyderabad, Hyderabad, India | Shivin Yadav | |
| MABIC | National Institute for Mathematical Sciences, Daejeon, Korea | Sungho Kang | |
| NJUST | Nanjing University of Science & Technology, China | Qiang Chen | |
| RetinAI | RetinAI Medical GmbH and University of Bern, Switzerland | Stefanos Apostolopoulos | |
| RMIT | RMIT University, Melbourne, Australia | Ruwan Tennakoon | PDF (suppl) |
| SFU | Simon Fraser University, Burnaby, Canada | Donghuan Lu | |
| UCF | University of Central Florida, Orlando, US | Dustin Morley | |
| UMN | University of Minnesota, Minneapolis, US | Abdolreza Rashno |
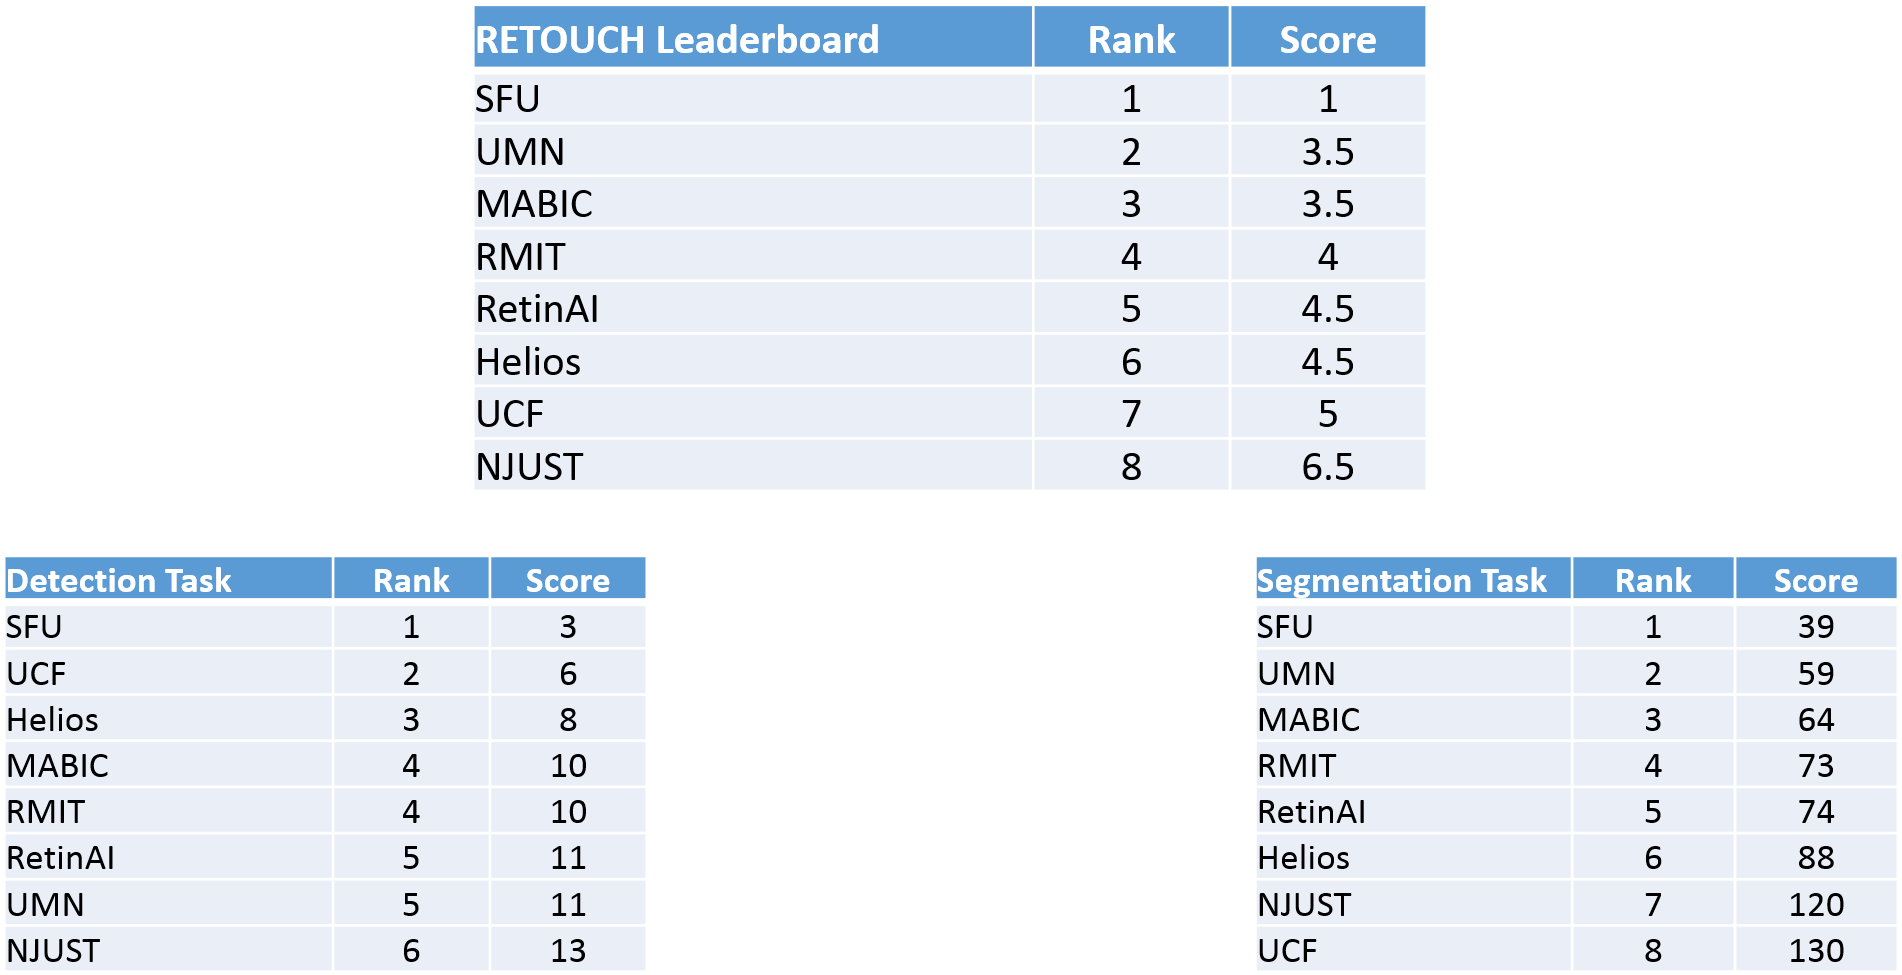
RESULTS
The average rank-score across the two tasks (detection and segmentation) determined the final RETOUCH ranking. In case of a tie, the segmentation performance had the preference.
Segmentation Task Details
Each team received a rank (1=best) for each combination of: Fluid type x OCT device x Error measure, based on the mean error measure value over the corresponding set of test images. The segmentation task score was determined by adding the 18 individual ranks. The team with the lowest segmentation score was ranked #1 on the segmentation task leaderboard.

Dice Score (DSC)
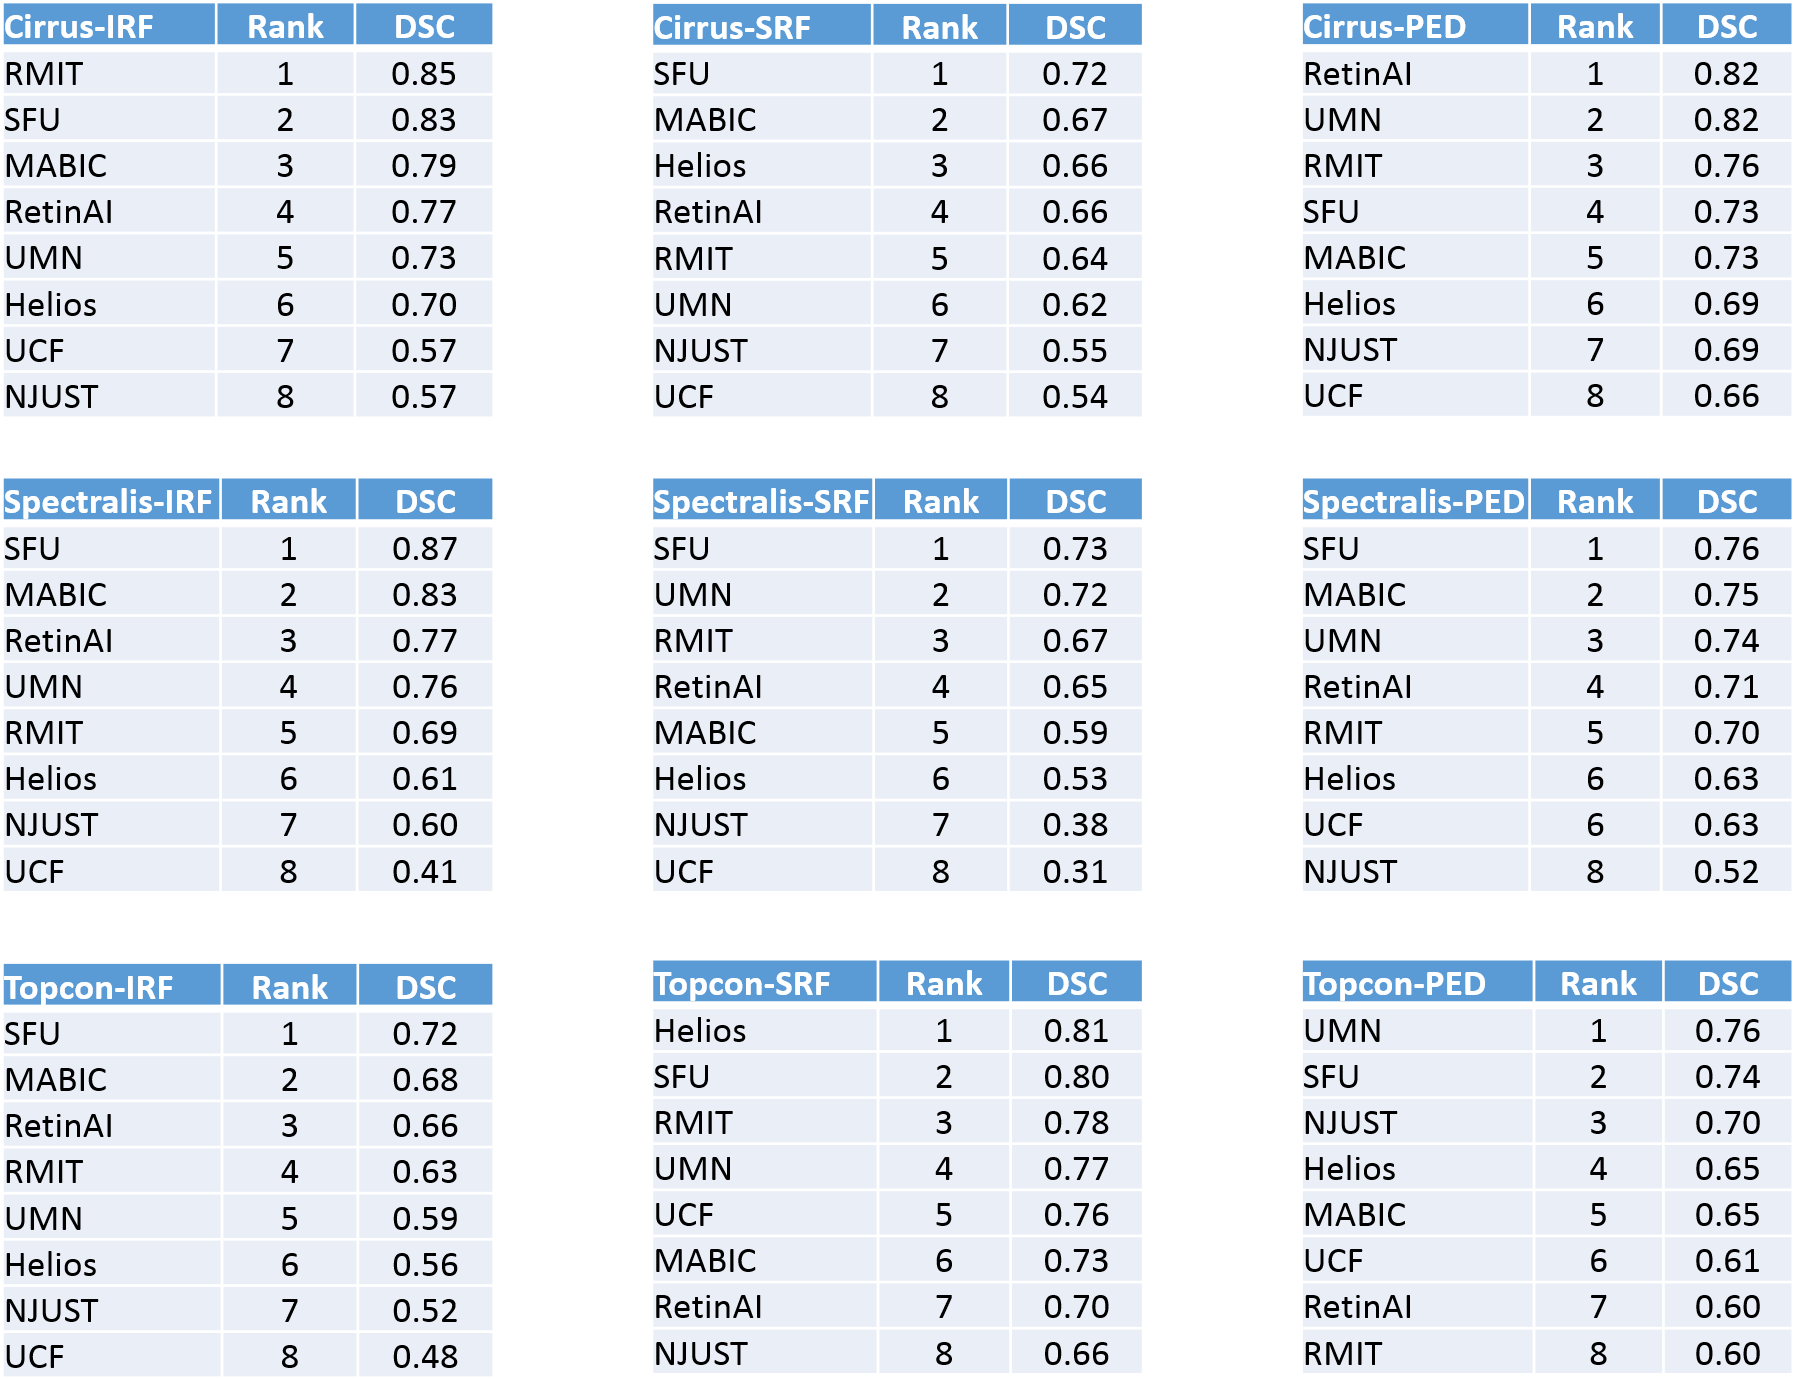
Absolute Volume Difference (AVD)
Detection Task Details
For each fluid type (IRF, SRF and PED): the Receiver Operating Curve
(ROC) was created across all the test set images and an area under the
curve (AUC) was calculated. Each team received a rank (1=best) for each
of the fluid types based on the obtained AUC value. The detection task
score was determined by adding the three fluid type ranks. The team with
the lowest detection score was ranked #1 on the detection task
leaderboard.

